
Furniture Shopping in the AI Era: How to Find What Fits Your Home
You find a bed you like, save a few room photos and ask an AI tool for alternatives. Your shortlist grows. Now you need to work out which option fits your room and the way you want to use it.
 Open larger diagram
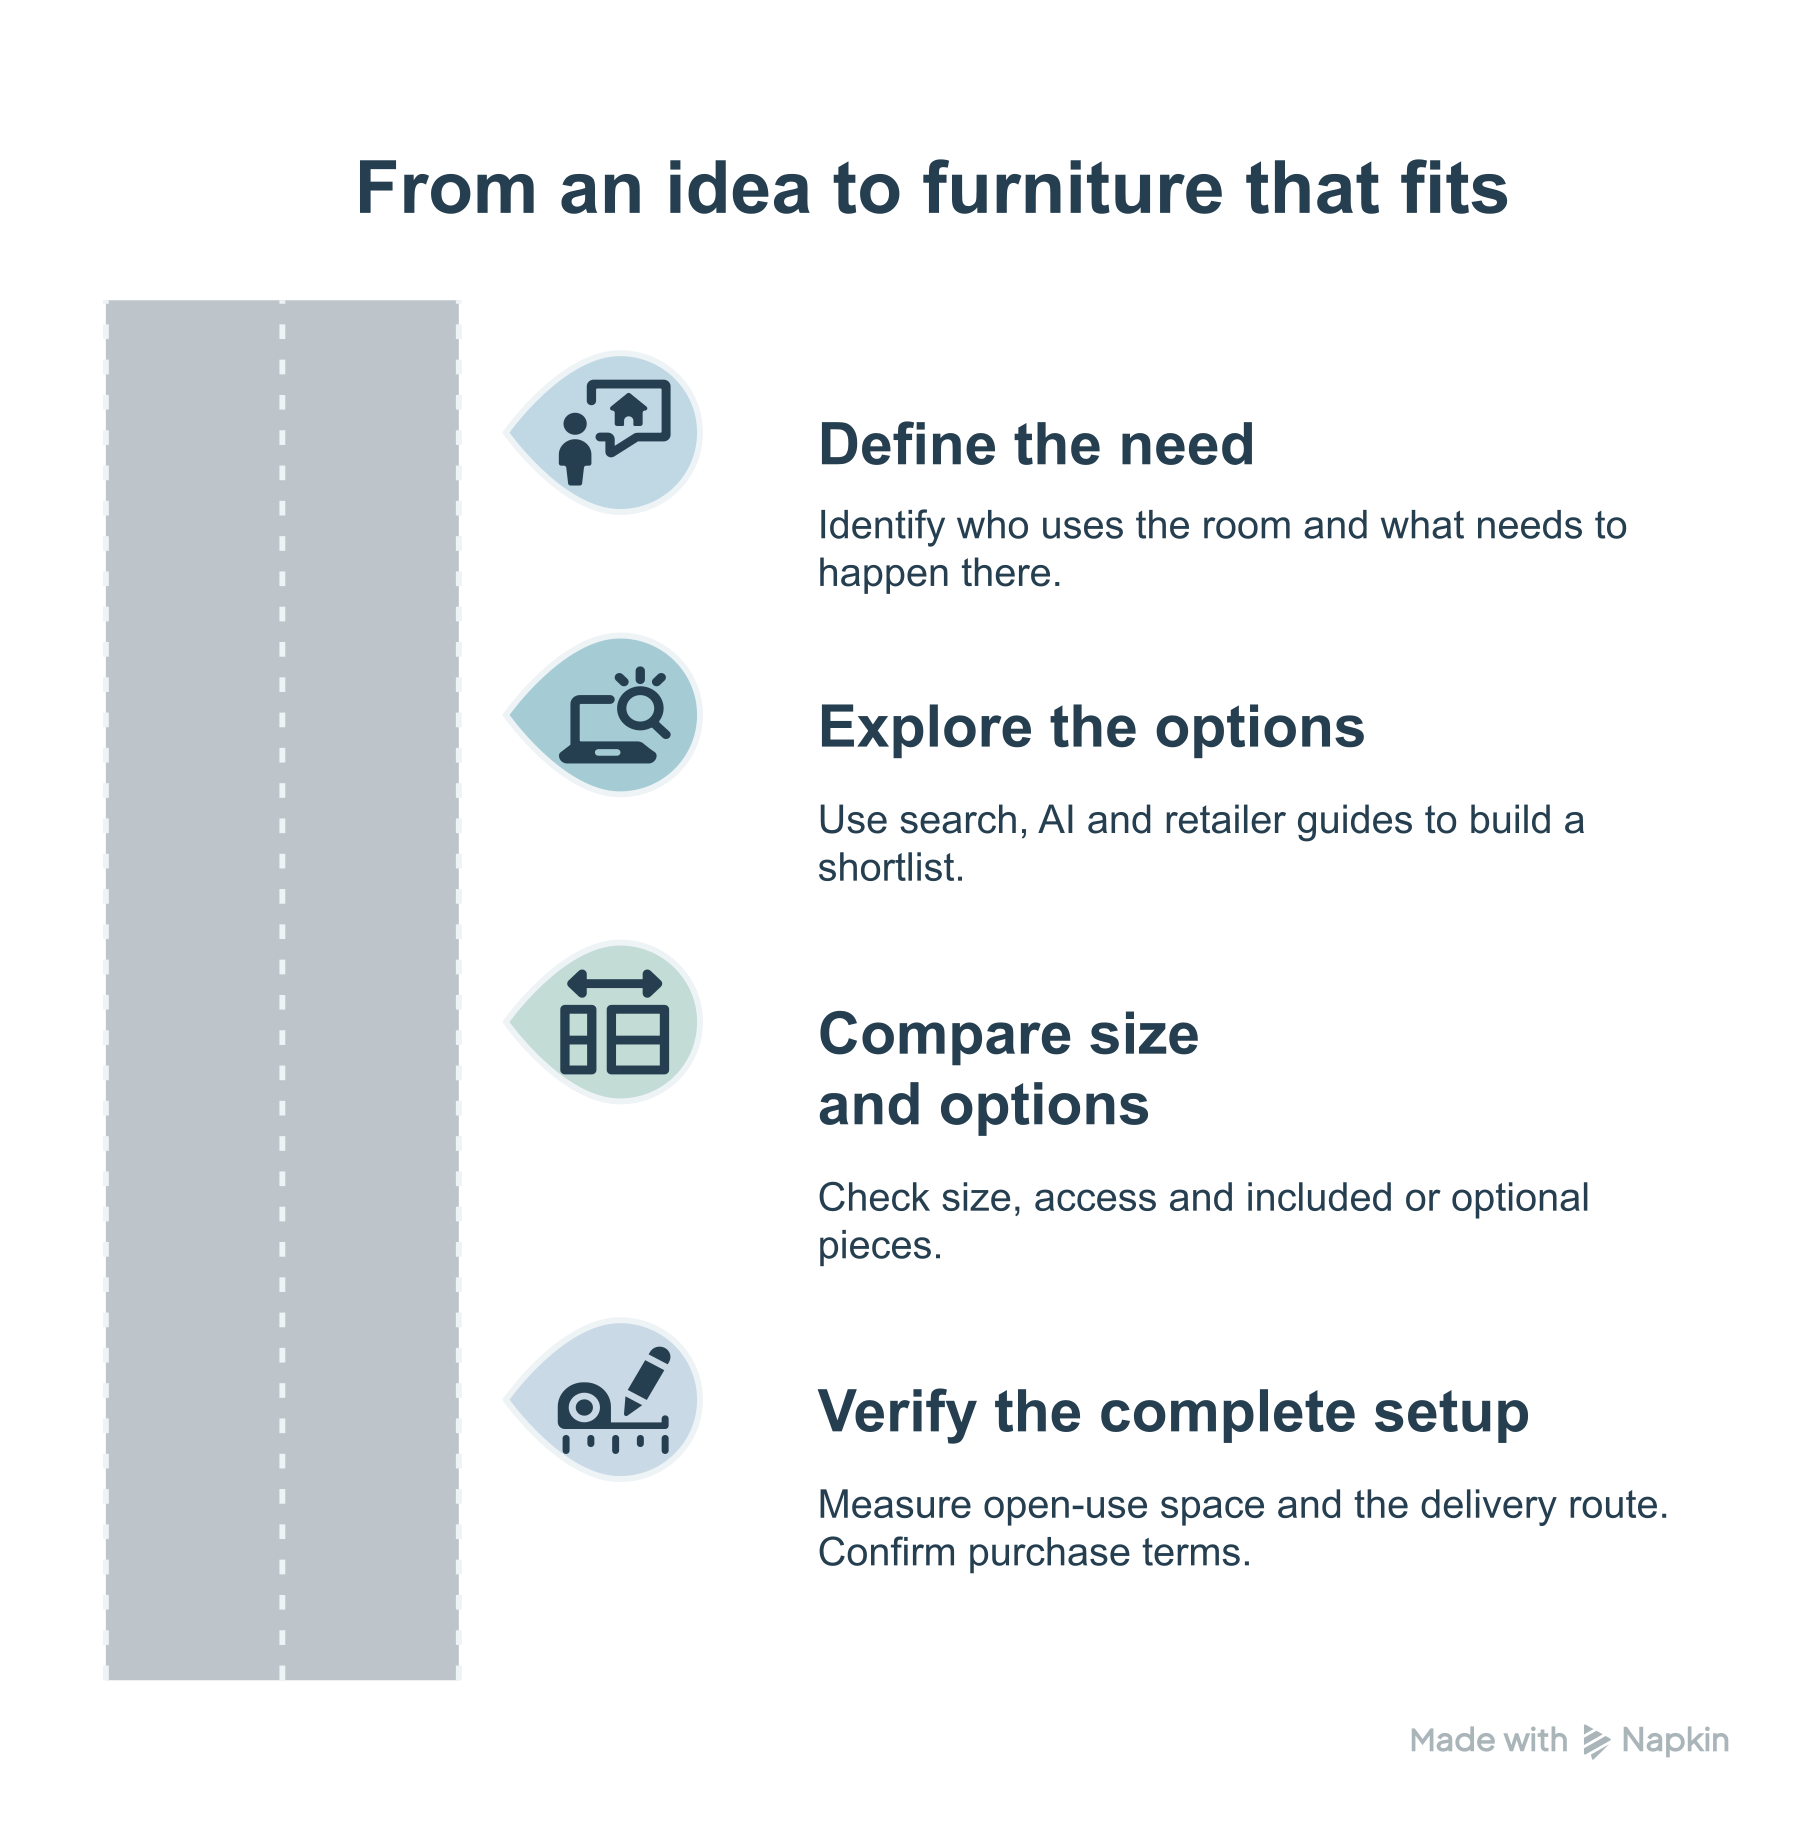
Four steps from a room brief to a furniture shortlist.
Start with your room and the job the furniture needs to do. Search and AI can introduce possibilities. Compare the exact size, options and space each choice needs, including pieces that pull out, swing open or sit beside it.
This guide draws on our five-year study of U.S. search trends, furniture shopper research and observations from Totally Home. You can explore the full findings and methods in the research appendix.
Explore the research appendix: charts, data tables, sources and methods
1. Start with what the room needs to do
Before searching for a product, write down what a successful room would let you do. A guest room might also be an office. A child might want both a sleeping area and a place to read. You may need everyday storage, occasional extra sleeping space or room for furniture you already own.
Write down the essentials first: an occasional guest bed, a permanent desk and a clear route to the closet, for example. Add who will use the furniture, the mattress sizes you need and your budget for the complete setup. Then list the styles and features you would like.
Consider a few arrangements. A daybed serves as seating and a bed. A loft raises the sleeping surface to leave space below, while a Murphy bed folds up into a cabinet or against a wall. Each can help a bedroom do double duty. Picture the room during the day and when everyone is ready for bed.
2. Use search trends to widen your options
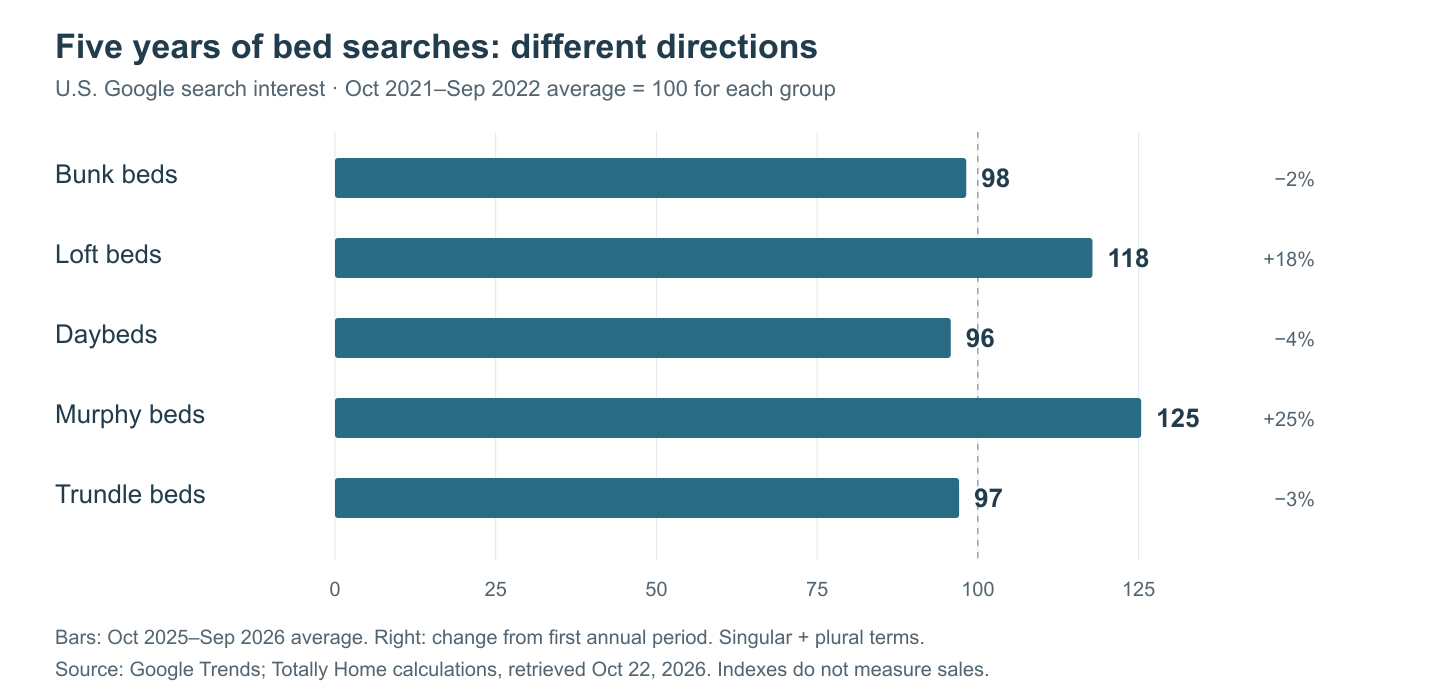
Our five-year Google Trends study shows how searches for different bed types changed through September 2026. Murphy-bed and loft-bed search interest finished above their own starting levels. Bunk-bed, daybed and trundle-bed searches ended closer to their starting points.
 Open larger chart
U.S. Google Web Search, October 2021–September 2026. Each bed group’s first-year average is set to 100. A value of 125 means search interest was 25% higher than that group’s own first-year average. Source: Google Trends; Totally Home calculations.
Use these patterns to explore bed types you may not have considered. If a bedroom also needs to work as an office, compare how a loft, a daybed or a Murphy bed would work with your desk, storage and daily routine.
3. Compare the size and options you would actually order
Searches that led to Totally Home paired bed types with requirements such as extra-long (XL) sizing, storage, adult use, stairs and different upper- and lower-bed sizes. Adding your own requirements to a search can help you narrow the options.
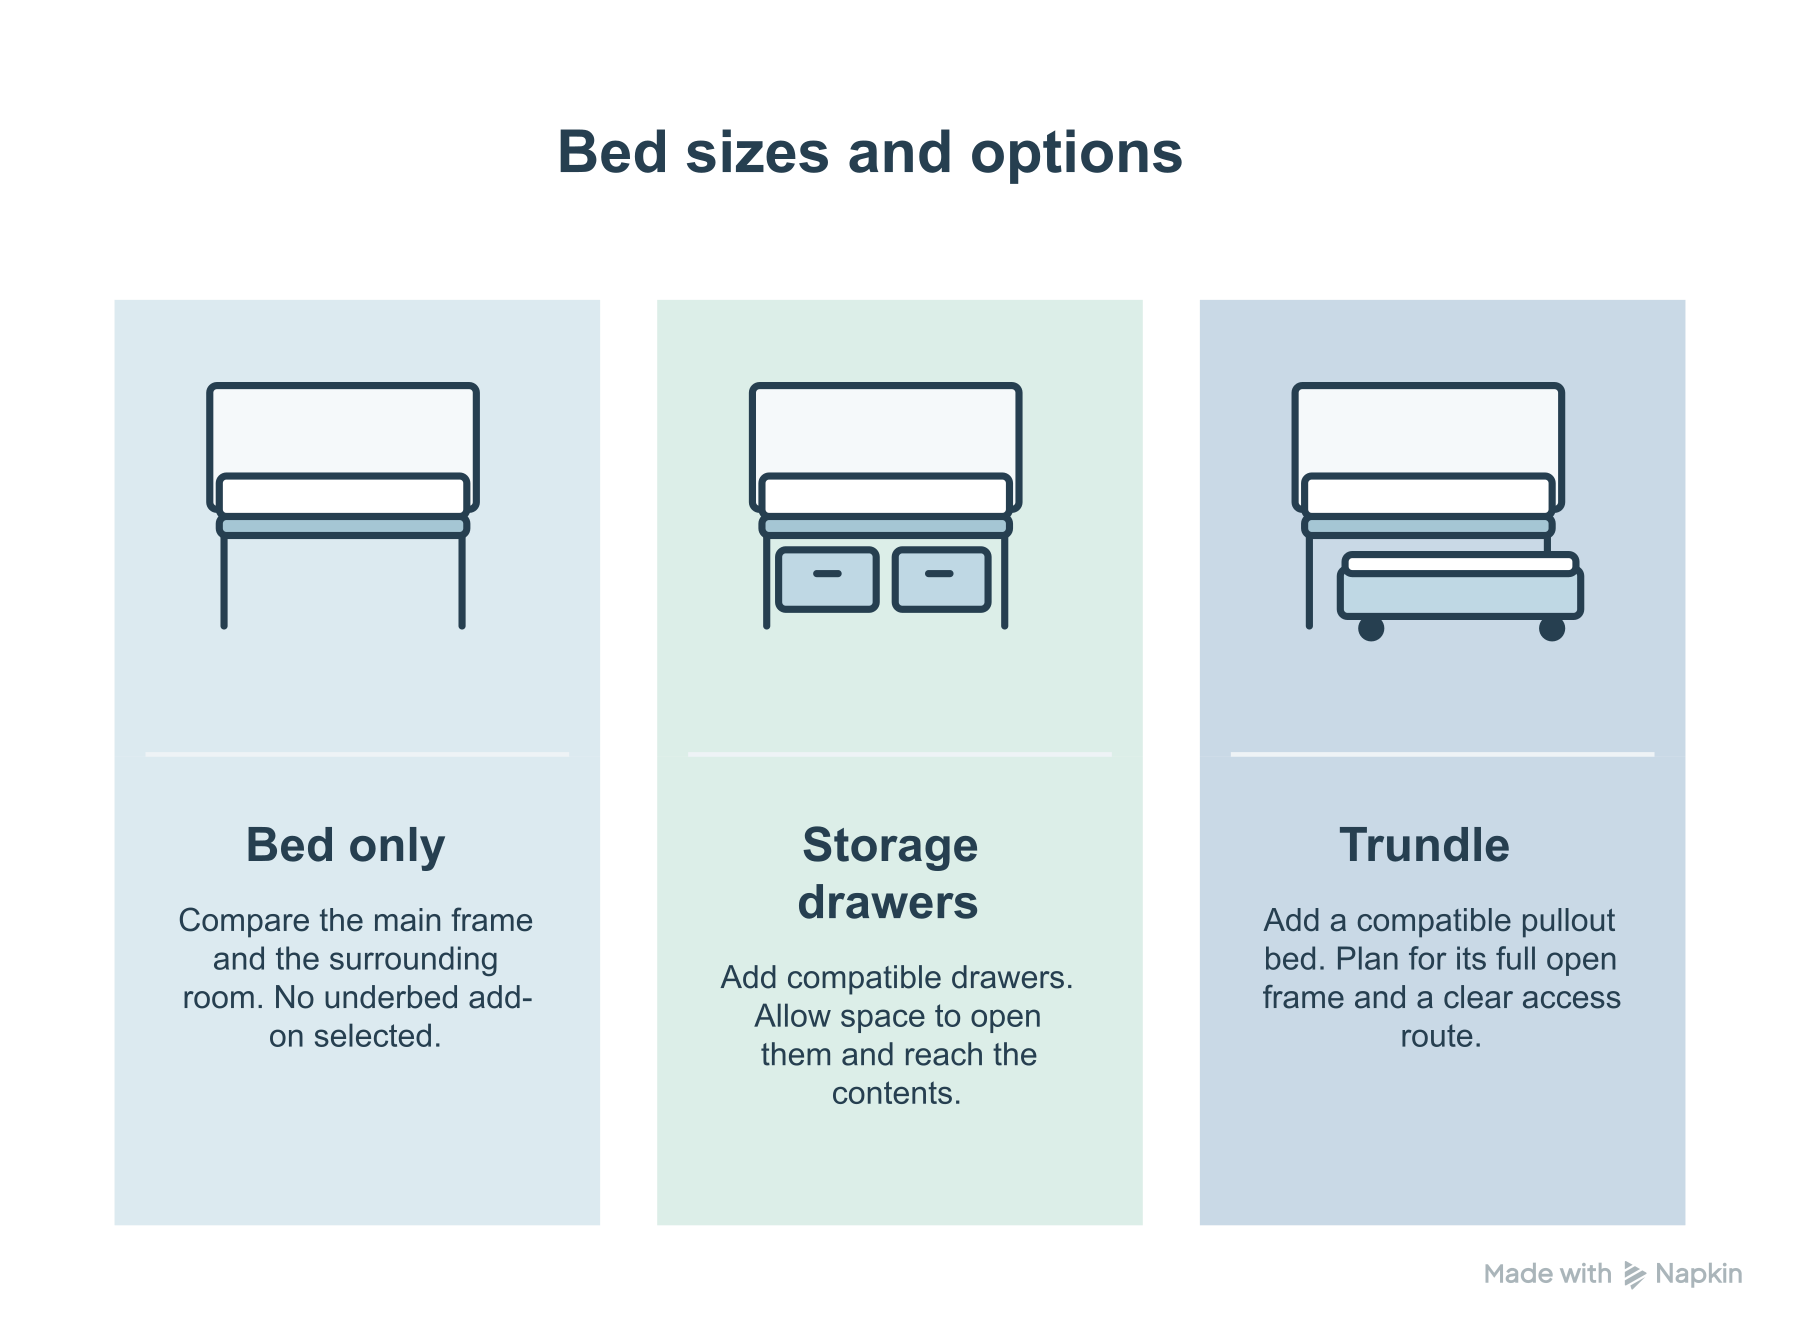
In our January–September 2026 shipped-order records, customers selected different versions of the same bunk- and loft-bed models: the main bed on its own, with drawers or with a trundle—a separate bed that pulls out from underneath. Compare the version you plan to buy.
 Open larger diagram
Compare the underbed options available for your selected model.
Save the selected size and underbed option with the product link. Check which pieces are included, then compare the complete arrangement with the other furniture in your room.
Our Lily White Low Queen Loft Bed Frame offers a lower sleeping platform with open space underneath. Our Crystal White XL College Loft Beds have a higher loft with room below for separately chosen furniture. Measure that opening against the desk or dresser you want to put there.
One customer chose the Lily low Queen loft for a child and appreciated the play area underneath. The lower height made it easier to see and help their child in bed. Read the full customer review for their experience.
Choose the height for your own plans. For an adult work area, compare the opening below the loft with your desk and chair, along with the headroom above the mattress. Look for reviews from customers using the same size and options in a similar room.
4. Give AI a room problem, then check its shortlist
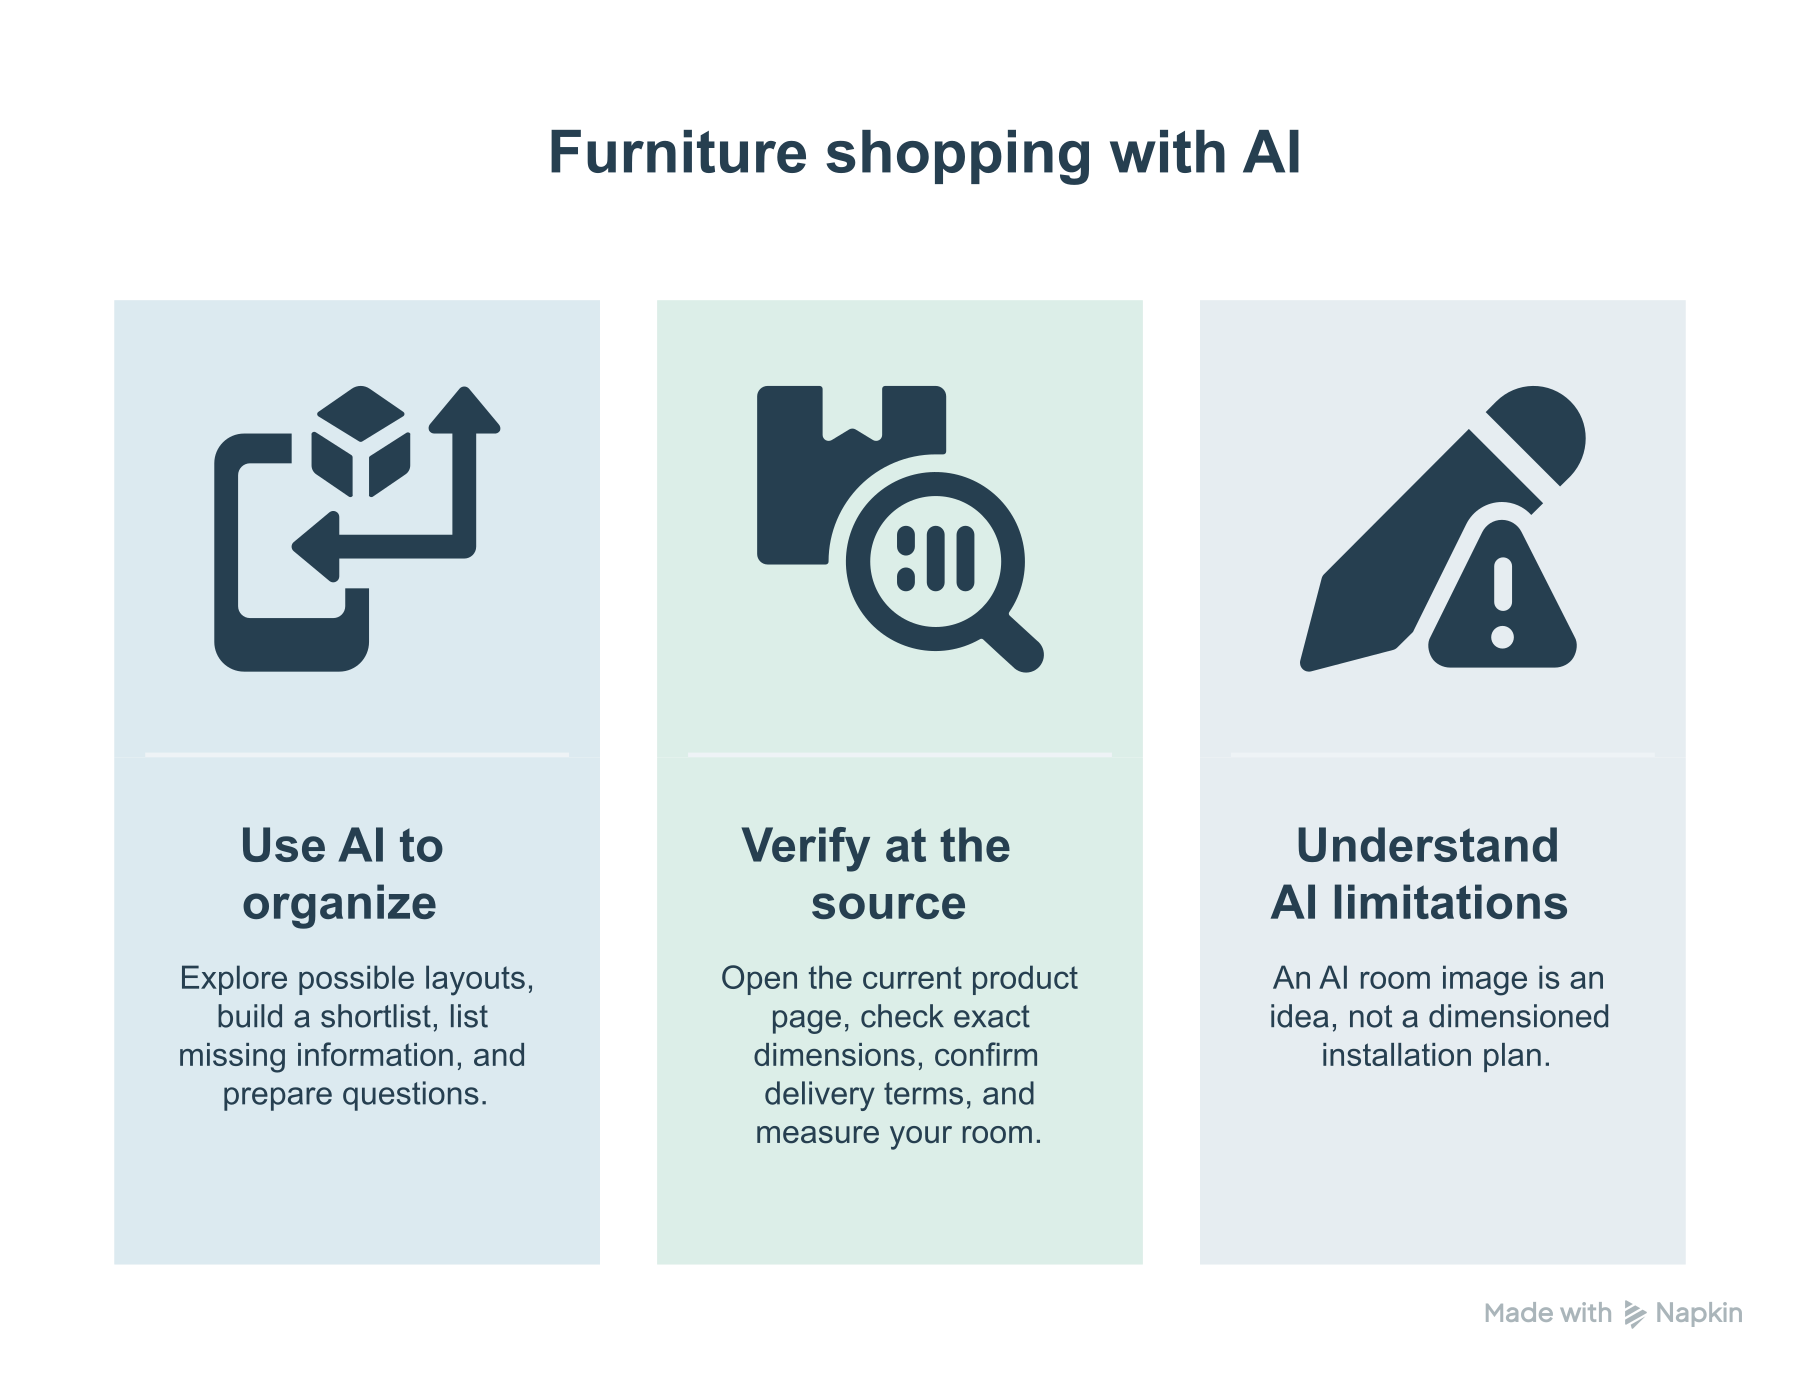
Use ChatGPT, Claude or Gemini to explore alternatives, list measurements to collect or organize a comparison sheet. Give the tool a specific room brief so it can focus on your needs.
 Open larger diagram
Use AI to organize your shortlist, then compare it with current product details and your room measurements. Use generated room images for inspiration.
Try this prompt:
“I am planning a guest room that also needs a permanent desk. Help me compare a daybed with a trundle, a loft and a Murphy bed. Ask me for the room measurements you need. For each product, include a current product link, the selected size and product-page dimensions. Flag any missing measurements.”
Add your room measurements, existing furniture and budget to the prompt.
Ask for one product per row, with columns for size and options, dimensions, included pieces, the product link and follow-up questions. Open the product page for the version you plan to buy.
Links from AI tools brought visits to both advice articles and bed-browsing pages at Totally Home during June–September 2026. Alongside product suggestions, ask the tool for buying guides that explain the choices you are weighing.
5. Check the complete setup before you decide
Dimensions, delivery details and reviews of long-term performance help shoppers evaluate furniture, according to Baymard Institute’s 2026 study of U.S. online furniture and home-decor shoppers. Keep those details alongside the room photos you save.
Use the same checks for each option on your shortlist:
Size and access. Note mattress width and length, outside frame dimensions and the space needed for the selected ladder or stairs. With a loft, compare headroom above the mattress and the opening below with your plans for both spaces.
Space when open. Mark where drawers, a trundle, doors or a folding bed will sit in use. Use the complete open furniture measurements. Keep the route to the door, closet and other furniture in the plan.
The complete purchase. Compare the selected size and options, included and optional pieces, mattress requirements, assembly arrangements and total price. Read the current warranty and return terms for that purchase.
Delivery and setup. Measure the route into the room and confirm the delivery service. If you need assembly or removal of existing furniture, establish those arrangements before choosing an arrival date.
If a needed measurement is missing, ask the retailer to confirm it before ordering.
Bring your room plan to Totally Home
Totally Home is a family-owned furniture retailer with roots in Totally Kids Fun Furniture, founded in 1983. Our selection serves the wider home, with particular depth in bunk beds, loft beds and bedroom furniture. We can help you work through the practical differences between the sizes and options you are considering.
Bring the product links, selected sizes, room measurements and notes about nearby furniture to our personal shoppers. We offer free, one-on-one help comparing the furniture you are considering and planning room fit. Call (800) 976-0102 or start with the personal-shopping page.
Research appendix: data, sources and methods
Detailed findings from our five-year search study and supporting research. Open any chart for a larger view.
Explore the data, sources and methods behind the guide.
Furniture spending adds a different perspective
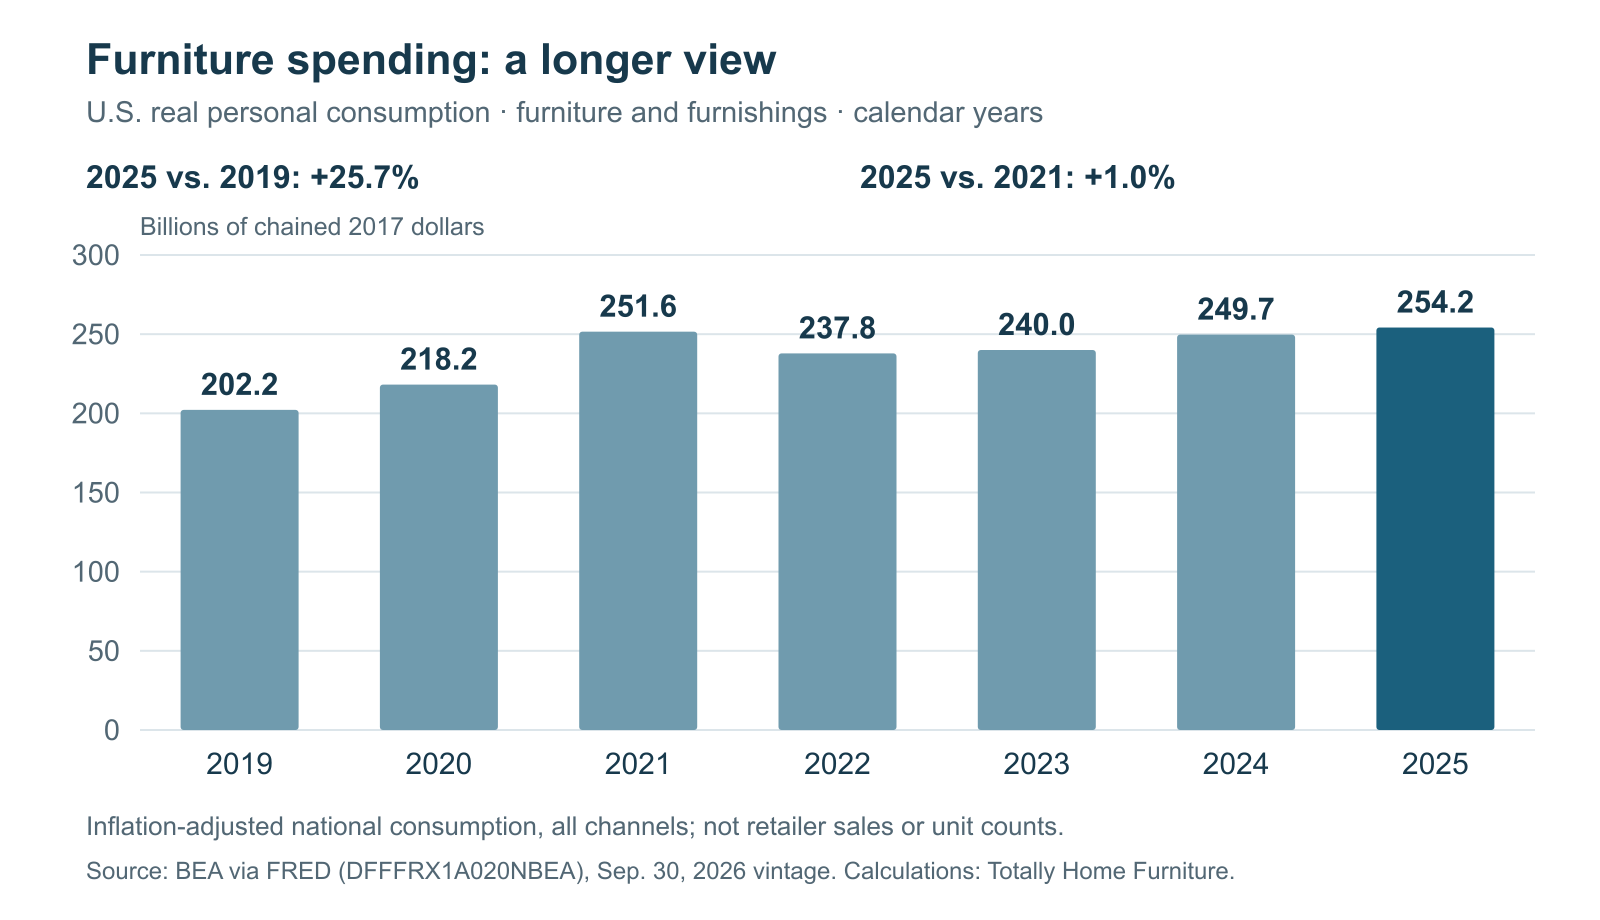
The U.S. Bureau of Economic Analysis estimates that real consumer spending on furniture and furnishings reached $254.2 billion in 2025, measured in chained 2017 dollars. That was about 26% above 2019 and about 1% above 2021. Spending fell in 2022, then increased in each of the next three calendar years. “Real” spending is adjusted for inflation, allowing comparison across years.
 Open larger chart
Calendar years; inflation-adjusted national spending, all purchase channels. Source: BEA via FRED, DFFFRX1A020NBEA, September 30, 2026 vintage; Totally Home calculations.
National spending and retailer-name searches provide different views of furniture shopping. The BEA series follows spending across purchase channels; the Google Trends series below follows searches for selected retailer names.
Household budgets provide another view. The Bureau of Labor Statistics reports average annual spending on household furnishings and equipment of $2,701 in 2021, $2,606 in 2022, $2,508 in 2023 and $2,414 in 2024. That is a nominal decline of about 11% across those years. These current-dollar averages cover all consumer units, including those that made no furniture purchase.
The two spending series describe different parts of the market. BEA tracks inflation-adjusted national spending on furniture and furnishings through 2025. BLS tracks average household spending in current dollars on the broader furnishings-and-equipment category through 2024.
A recent rebound can coexist with a longer decline
Six of the seven retailer terms had lower average search interest in October 2025–September 2026 than in October 2021–September 2022. Yet most rose compared with the immediately preceding year. Looking only at the latest year would miss that longer context.
| Retailer search term | 2021/22 | 2022/23 | 2023/24 | 2024/25 | 2025/26 | Latest YoY |
|---|---|---|---|---|---|---|
| Wayfair | 100 | 92 | 78 | 71 | 76 | +7% |
| IKEA | 100 | 89 | 87 | 83 | 92 | +12% |
| Ashley Furniture | 100 | 79 | 72 | 65 | 78 | +20% |
| Rooms To Go | 100 | 85 | 71 | 59 | 59 | ≈0% |
| Crate and Barrel | 100 | 93 | 83 | 75 | 78 | +4% |
| Pottery Barn | 100 | 88 | 84 | 79 | 94 | +19% |
| West Elm | 100 | 84 | 71 | 67 | 104 | +56% |
Each term’s first annual average = 100. Annual periods run October–September. A value of 76 means 24% below that retailer term’s own baseline. Source: Google Trends; Totally Home calculations.
For example, Wayfair’s latest annual average was about 24% below its first-year level, while increasing about 7% from the previous year. IKEA was about 8% below its first-year level and up about 12% year over year. Rooms To Go was approximately flat in the latest comparison, at a lower level than the first period.
West Elm deserves a closer look. Its annual mean rose about 56% in the latest year, but its median weekly index rose only about 7%. A pronounced spring 2026 spike makes the mean look much stronger than a typical week. Removing each year’s four highest weeks reduces the estimated increase to about 38%.
Bed searches tell a different story
The five bed-type groups followed different paths. Comparing the latest full year with the first, Murphy-bed searches were about 25% higher and loft-bed searches about 18% higher. Bunk-bed, daybed and trundle-bed searches ended closer to their starting levels. Each group combines its singular and plural terms.
The same bed-search analysis across all five periods is shown below. The main-story chart compares the first and last of these annual averages.
| Bed search group | 2021/22 | 2022/23 | 2023/24 | 2024/25 | 2025/26 | Latest YoY |
|---|---|---|---|---|---|---|
| Bunk | 100 | 87 | 87 | 85 | 98 | +16% |
| Loft | 100 | 89 | 86 | 86 | 118 | +37% |
| Daybed | 100 | 86 | 82 | 79 | 96 | +22% |
| Murphy | 100 | 100 | 103 | 103 | 125 | +21% |
| Trundle | 100 | 92 | 91 | 86 | 97 | +13% |
Each group’s first annual average = 100; periods run October–September. Follow each bed group’s search interest over time. Source: Google Trends; Totally Home calculations.
Murphy-bed interest stayed around its starting level through the middle years before its latest rise. Loft-bed interest followed a different path: three years below the baseline, then a roughly 37% year-over-year increase that put the latest year about 18% above the start.
Bunk, daybed and trundle searches also rose in the latest year, ending roughly 2%, 4% and 3% below their respective starting averages. The recent rebound was broad, while the five groups followed different paths over the full period.
There is more than one furniture-search season
Across the first four annual periods, the grouped daybed and trundle searches reached their highest monthly average in July each year. Bunk-bed searches peaked in July or August. Murphy-bed searches peaked in January in all four. The fifth year brought spring peaks instead.
Plan your purchase around the move, guests or school-year change you have in mind. Allow time for delivery, room preparation and assembly.
How AI is becoming part of furniture discovery
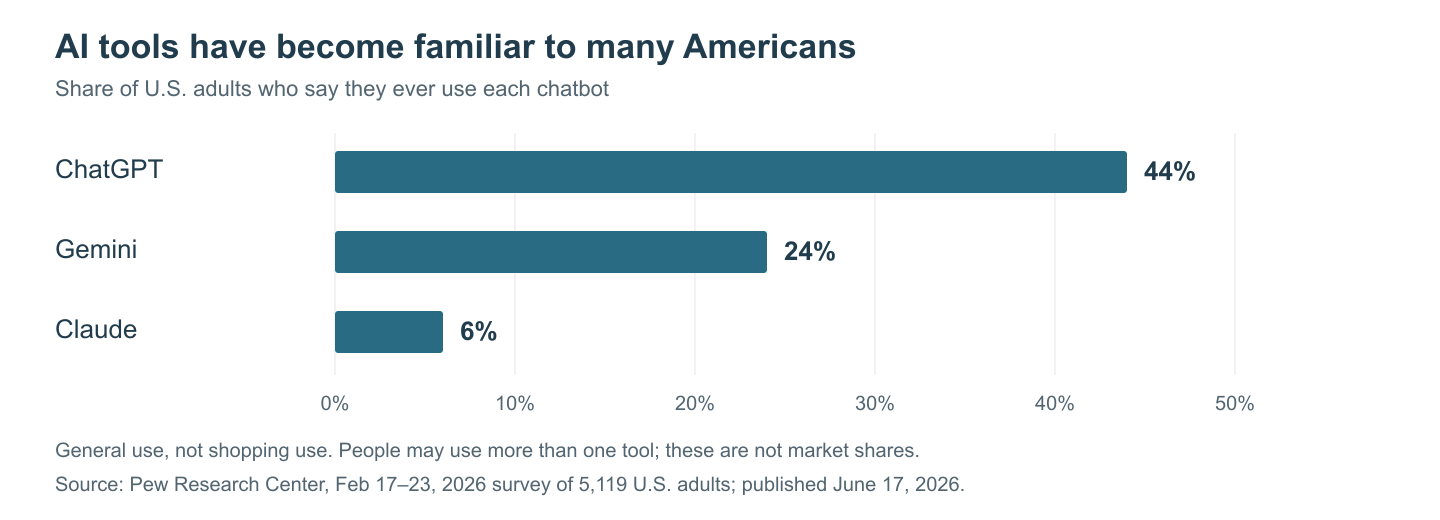
ChatGPT, Gemini and Claude add another place to ask questions, build a shortlist and compare options. Pew Research Center’s February 2026 survey of 5,119 U.S. adults found that 44% had used ChatGPT, 24% Gemini and 6% Claude for any purpose. Respondents could use more than one tool.
 Open larger chart
Share of U.S. adults who had used each tool, for any purpose. Source: Pew Research Center, February 2026 survey.
Across retail, Adobe reported that 39% of respondents to its companion U.S. survey had used AI for online shopping. Its analytics showed AI-sourced visits to U.S. retail sites growing 393% year over year in the first quarter of 2026. The research covered over one trillion retail visits and a survey of more than 5,000 respondents.
Furniture buyers have also expressed interest in AI. Provoke Insights’ summary of its Summer 2025 research reports that 65% of recent furniture buyers were interested in using AI while shopping, and 43% were comfortable with AI chat tools.
At Totally Home, U.S. visits classified as AI Assistant referrals landed on both reference articles and bed-browsing pages during June–September 2026. Advice and product browsing were both part of those arrival paths.
AI inside a search engine can change the next step, too. A separate Pew analysis of 900 U.S. adults’ browsing found traditional-result clicks on 8% of Google search visits with an AI summary, compared with 15% without one. The observational study used March 2025 browsing and search results reconstructed in April.
How we built this study
We used Google Trends Web Search, United States, All categories, for October 1, 2021–September 30, 2026, retrieved October 22, 2026. The selected retailer terms were Wayfair, IKEA, Ashley Furniture, Rooms To Go, Crate and Barrel, Pottery Barn and West Elm. Searches for these names include furniture, other products and store-related questions.
Bed groups combine bunk bed + bunk beds; loft bed + loft beds; daybed + daybeds; Murphy bed + Murphy beds; and trundle bed + trundle beds. Google explains how search terms and groups work.
Google supplied 262 weekly buckets per query. We estimated annual averages by weighting each bucket for the days overlapping each October–September period, then set each series’ first annual average to 100. Each series is compared with its own baseline. Percent changes are rounded.
Google Trends uses sampled, rounded indexes of search interest relative to all Google searches. Sampling, term choice, news and seasonality can affect results. Google also excludes internal searches made by AI Mode and AI Overviews. We retained the spring 2026 spike and checked its effect by comparing means, medians and results with the four highest weeks removed.
The added spending series is BEA real personal consumption expenditures for furniture and furnishings, annual 2019–2025, retrieved from FRED on October 22, 2026 using its September 30 revision. BLS figures are nominal average consumer-unit spending for the broader household furnishings and equipment category, 2021–2024. Our reported percentage changes use unrounded source values.
The shopper studies cover different populations and questions. Baymard studies online furniture/home-decor shoppers. Provoke’s overall cross-industry study surveyed 1,500 Americans; its public furniture-buyer summary leaves the subgroup size unspecified. Pew measures general AI use or Google browsing; Adobe covers broad retail referrals and shopping responses. Each percentage is reported within its study’s own sample and question.
Our qualitative search observations use reported U.S. Web queries for June 6, 2025–October 5, 2026, cross-checked against an overlapping July 19–October 16, 2026 export. Coverage depends on reported queries, rankings and our assortment.
Order observations cover January–September 2026 and use explicit selected options in positive-quantity lines from positive-value, currently shipped orders with no recorded refund. Adding awaiting-fulfillment and partially shipped orders preserved the same configuration themes.
First-party AI observations use U.S. GA4 landing pages and recognized AI Assistant referrals for June–September 2026. Google introduced this dedicated referral classification in May 2026, giving us a consistent starting point for this review.

Recent Posts
-
Furniture Shopping in the AI Era: How to Find What Fits Your Home
You find a bed you like, save a few room photos and ask an AI tool for alternatives. Your shortlist … -
A Bunk Bed for One Child: Room for Everyday Life and Future Plans
One child can have plenty of reasons to keep a bunk bed: a favorite sleeping level, a reading spot … -
More Beds, Not More Bedrooms: What an Extra Sleeping Spot Is Worth to a Short-Term Rental
Quick Nav Overview Why Guest Count Sets Your Rate Before Bedroom Count Does What One Extra Sleepin …